
URBANISED TERRITORIES
Cities do not simply experience climate change. They transform and amplify it.
Urbanised territories concentrate population, infrastructure and economic activity, making them especially sensitive to climate extremes. In Bulgarian cities, climate processes interact with urban form to create systemic risks, cascading impacts and new patterns of vulnerability.
SCROLL TO EXPLORE ↓
01 / CITIES AS CLIMATE SYSTEMS
The city changes the climate signal before people experience it.
Bulgarian cities function as complex and dynamic geographic systems. Climate factors interact with urbanisation, infrastructure, ecosystems and social structures, meaning that a local climate impact can trigger much wider consequences across the urban system.
Heat, rainfall and extreme events provide the external climatic signal.
Buildings, sealed surfaces and infrastructure modify how that signal is expressed.
Population, infrastructure and social conditions determine the resulting impact.
02 / THE ENERGY BALANCE CHANGES
Concrete, asphalt and buildings fundamentally alter the urban energy balance.
Replacing natural surfaces with artificial materials increases heat storage and reduces evaporation. More available energy is converted into sensible heat, while building geometry traps radiation and restricts air exchange.
03 / URBAN HEAT ISLAND
The Urban Heat Island is a structural property of the city.
The Urban Heat Island — UHI — emerges from the transformation of the urban energy balance. It has both atmospheric and surface components, while surface temperatures can vary strongly over short distances depending on land cover and urban structure.
The city can systematically remain warmer than its surroundings, particularly where dense construction and impermeable surfaces dominate.
04 / A NEW HEAT REGIME
Hot days are becoming more frequent — and increasingly concentrated into longer periods.
Climate projections show a systematic shift toward higher temperatures and more frequent extremes. The increase in hot days is therefore not only a change in frequency: it also increases the probability of prolonged periods of accumulated heat stress.
Lyulin, Sofia · CMIP5 RCP scenarios · reference period and future projections
Box-plot values are visually reconstructed from the supplied source figure for presentation use.
Source: meteoblue AG (2026), Number of hot days (projection), Lyulin, Sofia, Bulgaria.
05 / HEAT ACCUMULATES
The problem is not only hotter days. Cities increasingly struggle to cool down.
The warm season is becoming longer and periods of high temperature persist for longer. Urban materials accumulate heat during the day and release it slowly, limiting thermal recovery after sunset.
Artificial surfaces absorb and store incoming energy.
Stored heat is released slowly, keeping urban temperatures elevated.
Higher night-time temperatures reduce opportunities for physiological recovery and increase cumulative heat stress.
06 / THE CITY IS NOT THERMALLY UNIFORM
Urban form determines where heat concentrates — and where cooling remains possible.
Analysis of Lyulin in Sofia demonstrates clear spatial differentiation of surface temperature between Local Climate Zones. Land cover and urban morphology strongly influence how the same regional climate signal is expressed inside the city.
Relationship between land-cover type and LST across Local Climate Zones in Lyulin, Sofia
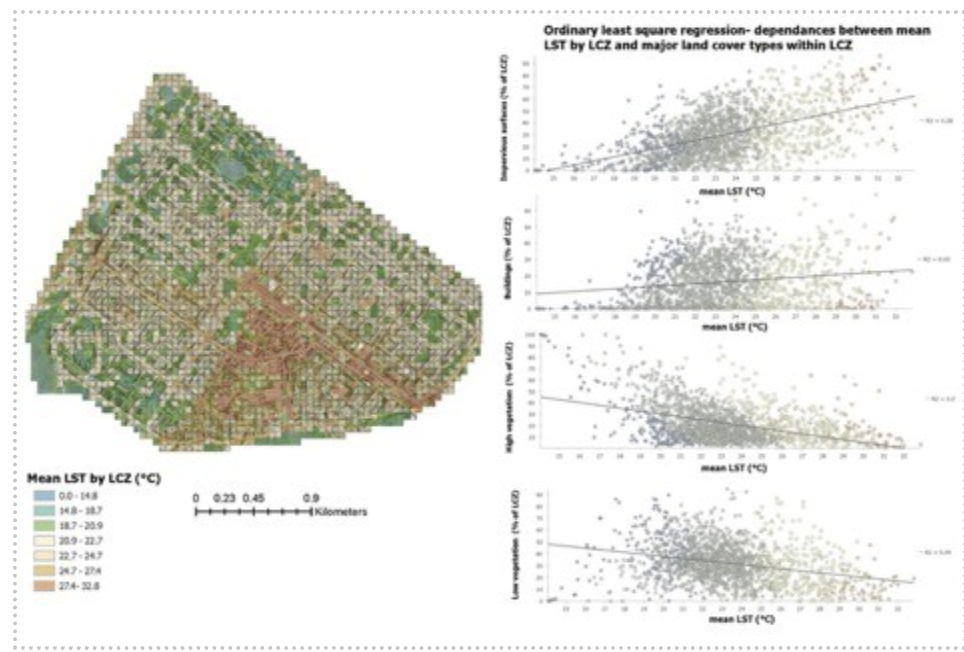
Source: author calculations based on satellite observations and Local Climate Zones classification methodology.
07 / SURFACES MATTER
Impermeable surfaces amplify heat. Vegetation reduces it.
The relationship between land cover and surface temperature confirms that urban structure can function either as an amplifier or as a reducer of climate risk.
Buildings, asphalt and sealed surfaces increase heat accumulation.
Shade and evapotranspiration provide a clear cooling effect.
08 / THE URBAN WATER CYCLE
Urbanisation also changes how the city responds to intense rainfall.
Increasing rainfall intensity interacts with surface sealing to create rapid runoff and reduce infiltration. This becomes especially critical in small and steep catchments, where response times can be extremely short.
Urban heat and urban flood risk are therefore connected through the same transformation of natural surfaces.
09 / ADAPTATION MUST BE INTEGRATED
Climate adaptation is not a single intervention. It is a redesign of how the urban system works.
Effective adaptation combines green and blue infrastructure, spatial planning and contemporary geospatial technologies. These measures can simultaneously reduce heat exposure, improve water management and increase resilience.
Vegetation, trees and green spaces provide shading, cooling and ecosystem functions.
Water-sensitive design helps retain, infiltrate and manage stormwater.
Geospatial analysis identifies hotspots and supports targeted interventions.
10 / THE BIGGER PICTURE
Urban climate resilience begins with understanding where climate, urban form and vulnerability overlap.
Climate risk in cities is produced by the interaction between climatic hazards, the physical structure of the urban environment and social vulnerability. Adaptation therefore needs to identify not only where hazards occur, but where exposure and vulnerability transform those hazards into systemic risk.
Identify heat, extreme rainfall and changing climate conditions.
Map surfaces, morphology, infrastructure and critical spatial patterns.
Identify the people, systems and locations least able to absorb climate impacts.
Chapter author: Prof. Stelyan Dimitrov, Institute of Geospatial Research and Technology, Sofia University “St. Kliment Ohridski”
 English
  Bulgarian