FLOODS

Flood risk is not driven by rainfall alone. It is the response of the whole system.

Floods are among Bulgaria’s most significant natural hazards. Their frequency, intensity and spatial expression emerge from the interaction between climate, catchment geography and human transformation of the landscape.

SCROLL TO EXPLORE ↓

01 / A SYSTEMIC RISK

A flood is more than an extreme rainfall event.

Flood risk should be understood as the behaviour of an entire geosystem — including its internal constraints, sensitivity and resilience thresholds. Rainfall is the trigger, but catchment structure, runoff dynamics and human modification determine how that trigger becomes a disaster.

01Climate signal

Changing seasonality, intensity and short-duration concentration of precipitation.

02Catchment geography

Morphometry, slopes, drainage structure and the speed at which runoff is generated.

03Human pressure

Landscape transformation can create or intensify critical points of system failure.

02 / THE RAINFALL REGIME IS CHANGING

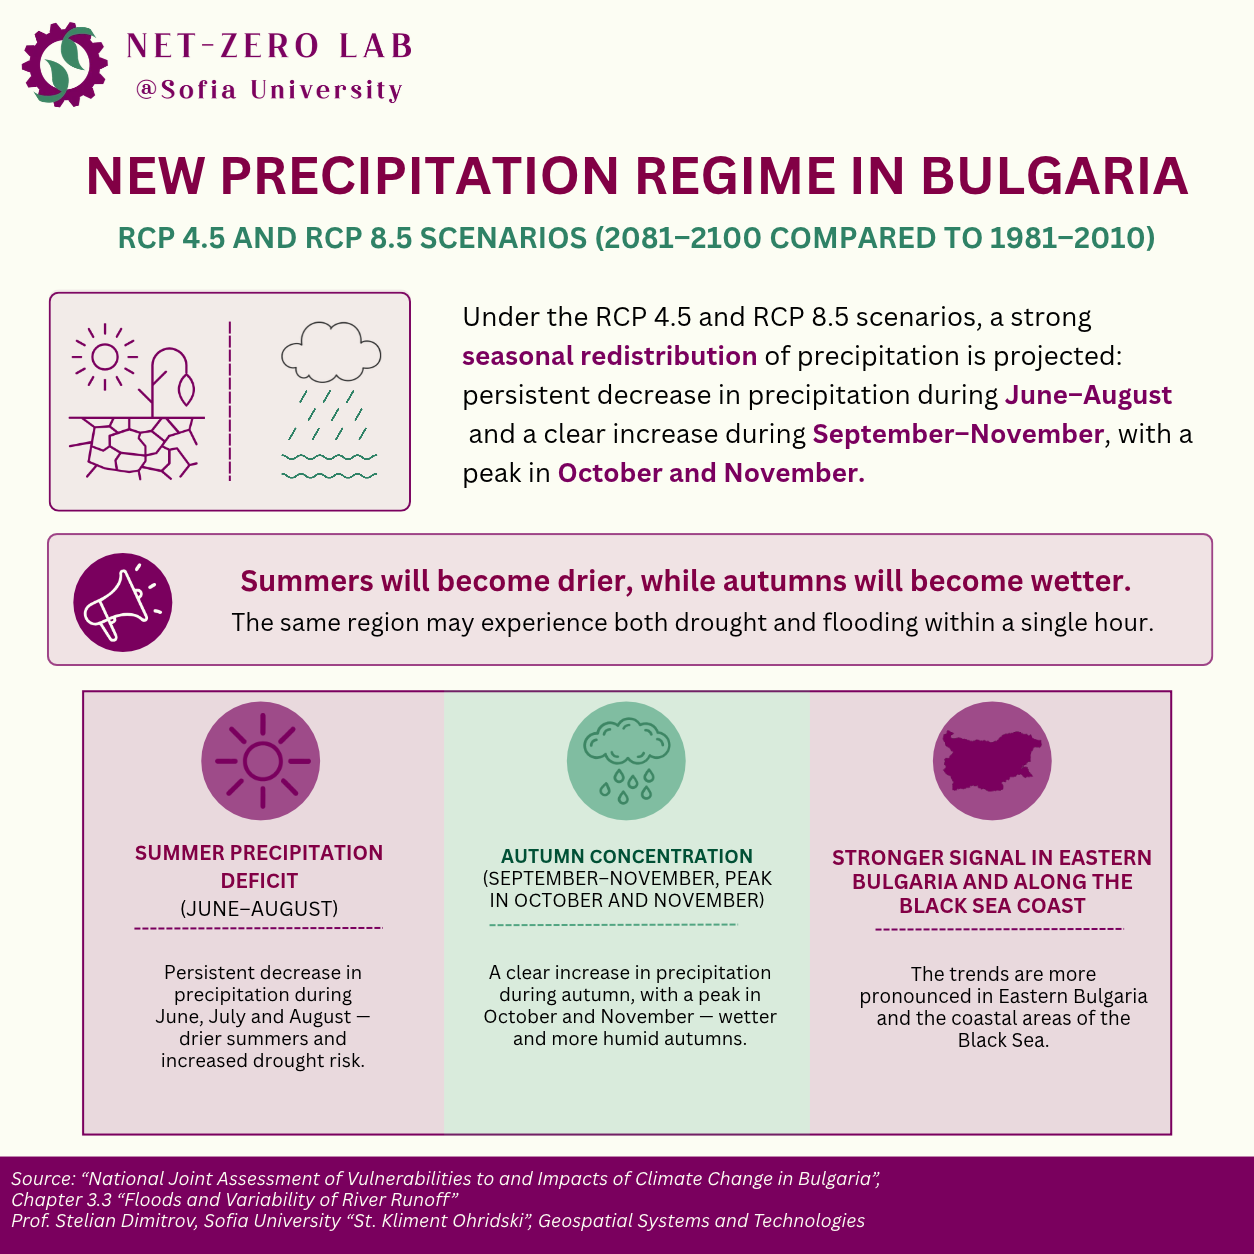
The key change is not simply annual rainfall. It is when and how the rain falls.

Bulgaria lies between temperate and Mediterranean climatic influences, creating naturally high rainfall variability. Under climate change, the strongest signal is a restructuring of the rainfall regime — its seasonality, intensity and concentration within shorter time intervals.

↓SUMMERPersistent decline in precipitation during June–August, increasing drought and water-deficit pressure.
↑AUTUMNIncreasing precipitation during September–November, with the strongest signal in October and November.
The annual total may remain broadly similar while the seasonal distribution changes in a way that increases exposure to both drought and flooding.

03 / CLIMATE SCENARIOS

Both RCP4.5 and RCP8.5 point toward stronger seasonal contrasts.

Analysis with the regional ALADIN-Climate/CNRM model shows a clear seasonal redistribution of precipitation. The summer drying signal appears under both scenarios, becomes stronger under RCP8.5 and intensifies toward the end of the century.

VI–VIIIsummer period with a persistent decreasing precipitation signal
IX–XIautumn period with an increasing precipitation signal
RCP4.5clear restructuring of the seasonal rainfall regime
RCP8.5stronger signal, especially toward the end of the century

04 / SEASONAL REDISTRIBUTION

Summer deficit and autumn surplus can occur within the same year.

The basin-level diagrams reveal the central result of the assessment: rainfall is redistributed rather than simply reduced. This opposing seasonal direction raises the probability of water scarcity in summer and intense runoff events in autumn.

FIGURE 01 Change in monthly precipitation totals by basin directorate

Percentage change relative to 1981–2010 · ALADIN-Climate/CNRM · RCP4.5 and RCP8.5

RCP 4.5
Up to 2050
2071–2100
RCP 8.5
Up to 2050
2071–2100
Decrease
≤−20 −20 −15 −10 −5 0 5 10 15 20 25 30 35 >40
Increase

05 / REGIONAL DIFFERENCES

The flood signal is not spatially uniform across Bulgaria.

The stronger autumn increase is concentrated in Eastern Bulgaria and along the Black Sea coast, while Western Bulgaria and the more continental interior show stronger summer deficits.

EASTStronger autumn increase

Eastern Bulgaria and the Black Sea coast show a clearer signal of increasing precipitation.

WESTStronger summer deficit

Western Bulgaria and inland continental areas show more pronounced summer drying.

The emerging regime combines summer rainfall deficit, autumn concentration and intensification, and greater seasonal contrast.

06 / FLASH FLOODS

Small, fast-responding catchments are becoming a critical flood-risk environment.

For Bulgaria, the main flood hazards are fluvial floods and flash floods. Flash floods are especially important because small catchments can respond extremely quickly when intense precipitation meets steep terrain, rapid runoff and vulnerable infrastructure.

01Intense rainfall
→
02Rapid runoff
→
03Critical bottleneck
→
04Flash flood

07 / THE PATTERN IS ALREADY VISIBLE

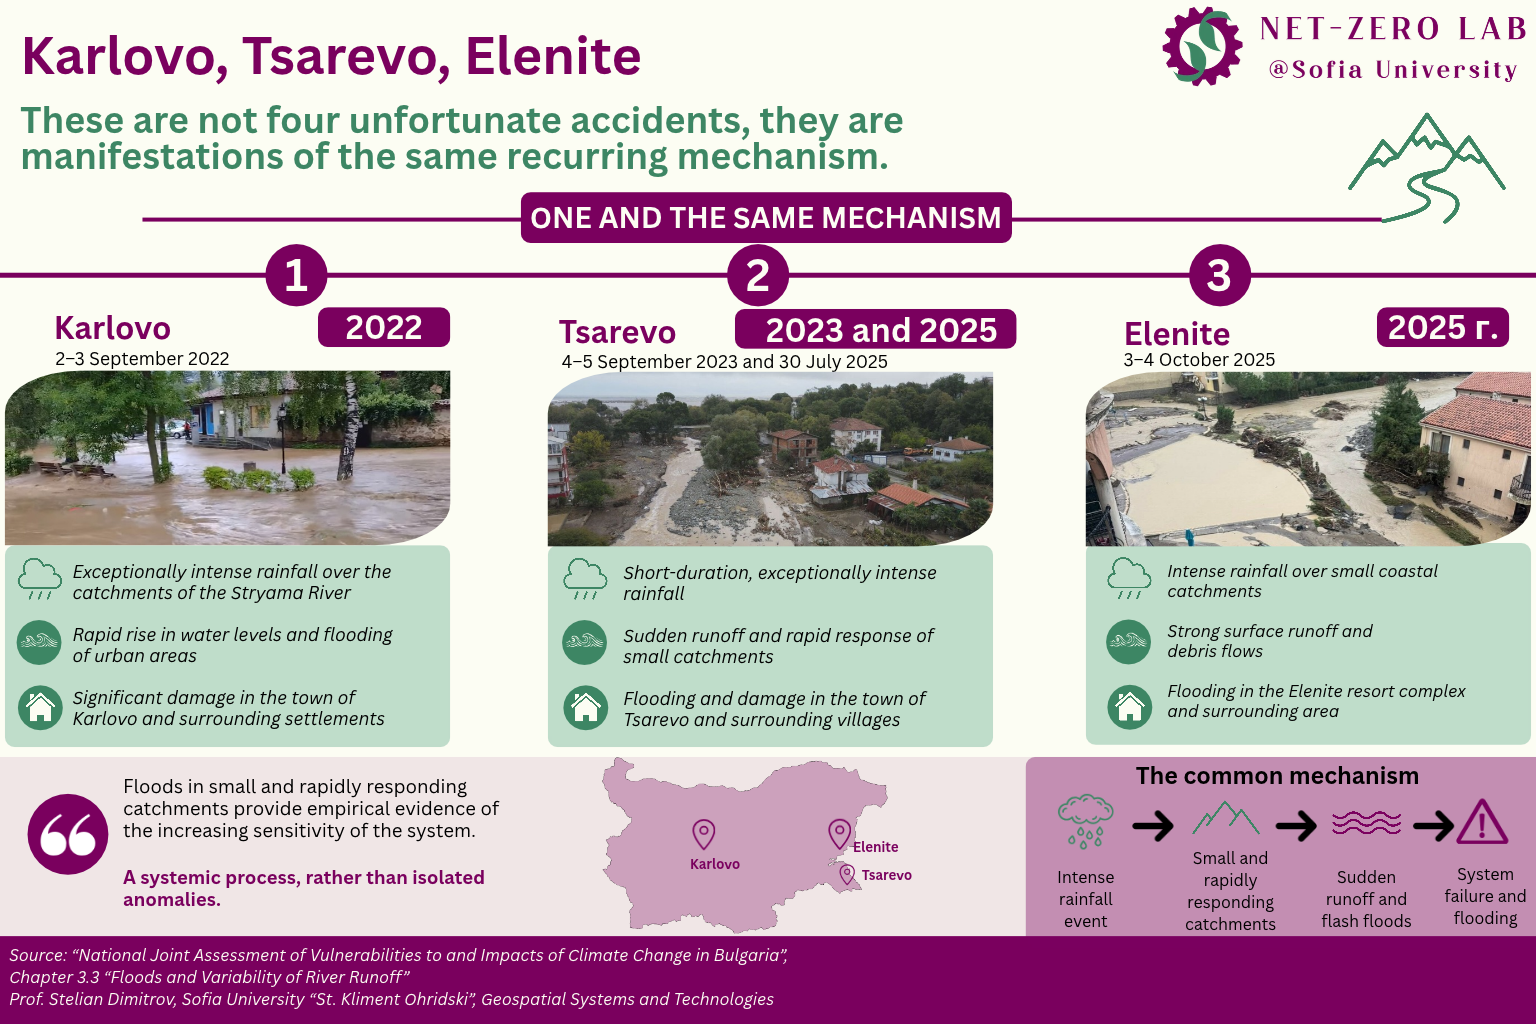
Karlovo, Tsarevo and Elenite reveal a recurring mechanism — not isolated anomalies.

Recent disasters demonstrate the interaction between an intense climatic impulse, catchment morphology, rapid runoff and critical points of system failure.

2022Karlovo region

An example of severe flooding produced by the interaction of intense precipitation and catchment response.

2023 & 2025Tsarevo

Repeated events highlight the sensitivity of fast-responding coastal catchments.

2025Elenite

A further example of intense rainfall interacting with rapid runoff and system vulnerability.

The common mechanism matters more than any single event: hazard emerges when climate, geography and vulnerable system points coincide.

08 / PRECIPITATION INTENSITY

The PI Index points to a stronger intensity signal toward the end of the century.

By 2050, changes are more moderate and spatially heterogeneous. Toward 2071–2100, the signal strengthens substantially — particularly under RCP8.5 — with high values emerging in Southern Bulgaria, the Rhodope region and along the Black Sea coast.

FIGURE 02 Spatial distribution of changes in the PI Index

Difference relative to 1981–2010 · ALADIN-Climate/CNRM · RCP4.5 and RCP8.5

RCP 4.5
Up to 2050
RCP4.5 PI Index change up to 2050
2071–2100
RCP4.5 PI Index change for 2071–2100
RCP 8.5
Up to 2050
RCP8.5 PI Index change up to 2050
2071–2100
RCP8.5 PI Index change for 2071–2100
Decrease in PI
Increase in PI

Spatial distribution of changes in the mean PI Index relative to the historical reference period.

09 / MODEL SIGNAL MEETS OBSERVED REALITY

The strongest modelled signals overlap with places where damaging floods have already occurred.

Southern Bulgaria, the Rhodope region, Eastern Bulgaria and the Black Sea coast contain some of the strongest projected PI Index increases. These areas overlap with locations of observed disasters including Asparuhovo, Karlovo, Tsarevo and Elenite.

OVERLAPModelled intensity signal + observed flood disasters

This does not mean climate alone determines each event. It shows that the spatial climate signal and observed vulnerability are converging in several high-risk regions.

10 / THE BIGGER PICTURE

Flood resilience requires spatial diagnosis, critical-point identification and risk management.

Flood risk in Bulgaria is the result of interaction between the climate signal, geographic structure and anthropogenic transformation. As flash-flood risk grows in small and rapidly responding catchments, adaptation must focus on how and where the system can fail — not only on how much rain is expected.

01Spatial diagnosis

Identify the catchments and settlements where climatic and geographic sensitivity overlap.

02Critical points

Map bottlenecks, vulnerable infrastructure and locations where system failure can amplify runoff impacts.

03Risk management

Combine monitoring, planning and adaptation around fast-changing flood conditions.

Chapther author: Prof. Stelyan Dimitrov, Institute of Geospatial Research and Technology, Sofia University “St. Kliment Ohridski”

FLOODS

Flood risk is not driven by rainfall alone. It is the response of the whole system.

Floods are among Bulgaria’s most significant natural hazards. Their frequency, intensity and spatial expression emerge from the interaction between climate, catchment geography and human transformation of the landscape.

SCROLL TO EXPLORE ↓

01 / A SYSTEMIC RISK

A flood is more than an extreme rainfall event.

Flood risk should be understood as the behaviour of an entire geosystem — including its internal constraints, sensitivity and resilience thresholds. Rainfall is the trigger, but catchment structure, runoff dynamics and human modification determine how that trigger becomes a disaster.

01Climate signal

Changing seasonality, intensity and short-duration concentration of precipitation.

02Catchment geography

Morphometry, slopes, drainage structure and the speed at which runoff is generated.

03Human pressure

Landscape transformation can create or intensify critical points of system failure.

02 / THE RAINFALL REGIME IS CHANGING

The key change is not simply annual rainfall. It is when and how the rain falls.

Bulgaria lies between temperate and Mediterranean climatic influences, creating naturally high rainfall variability. Under climate change, the strongest signal is a restructuring of the rainfall regime — its seasonality, intensity and concentration within shorter time intervals.

↓SUMMERPersistent decline in precipitation during June–August, increasing drought and water-deficit pressure.
↑AUTUMNIncreasing precipitation during September–November, with the strongest signal in October and November.

The annual total may remain broadly similar while the seasonal distribution changes in a way that increases exposure to both drought and flooding.

03 / CLIMATE SCENARIOS

Both RCP4.5 and RCP8.5 point toward stronger seasonal contrasts.

Analysis with the regional ALADIN-Climate/CNRM model shows a clear seasonal redistribution of precipitation. The summer drying signal appears under both scenarios, becomes stronger under RCP8.5 and intensifies toward the end of the century.

VI–VIIIsummer period with a persistent decreasing precipitation signal
IX–XIautumn period with an increasing precipitation signal
RCP4.5clear restructuring of the seasonal rainfall regime
RCP8.5stronger signal, especially toward the end of the century

04 / SEASONAL REDISTRIBUTION

Summer deficit and autumn surplus can occur within the same year.

The basin-level diagrams reveal the central result of the assessment: rainfall is redistributed rather than simply reduced. This opposing seasonal direction raises the probability of water scarcity in summer and intense runoff events in autumn.

FIGURE 01Change in monthly precipitation totals by basin directorate

Percentage change relative to 1981–2010 · ALADIN-Climate/CNRM · RCP4.5 and RCP8.5

CHART PLACEHOLDER

05 / REGIONAL DIFFERENCES

The flood signal is not spatially uniform across Bulgaria.

The stronger autumn increase is concentrated in Eastern Bulgaria and along the Black Sea coast, while Western Bulgaria and the more continental interior show stronger summer deficits.

EASTStronger autumn increase

Eastern Bulgaria and the Black Sea coast show a clearer signal of increasing precipitation.

WESTStronger summer deficit

Western Bulgaria and inland continental areas show more pronounced summer drying.

The emerging regime combines summer rainfall deficit, autumn concentration and intensification, and greater seasonal contrast.

06 / FLASH FLOODS

Small, fast-responding catchments are becoming a critical flood-risk environment.

For Bulgaria, the main flood hazards are fluvial floods and flash floods. Flash floods are especially important because small catchments can respond extremely quickly when intense precipitation meets steep terrain, rapid runoff and vulnerable infrastructure.

01Intense rainfall
→
02Rapid runoff
→
03Critical bottleneck
→
04Flash flood

07 / THE PATTERN IS ALREADY VISIBLE

Karlovo, Tsarevo and Elenite reveal a recurring mechanism — not isolated anomalies.

Recent disasters demonstrate the interaction between an intense climatic impulse, catchment morphology, rapid runoff and critical points of system failure.

2022Karlovo region

An example of severe flooding produced by the interaction of intense precipitation and catchment response.

2023 & 2025Tsarevo

Repeated events highlight the sensitivity of fast-responding coastal catchments.

2025Elenite

A further example of intense rainfall interacting with rapid runoff and system vulnerability.

The common mechanism matters more than any single event: hazard emerges when climate, geography and vulnerable system points coincide.

08 / PRECIPITATION INTENSITY

The PI Index points to a stronger intensity signal toward the end of the century.

By 2050, changes are more moderate and spatially heterogeneous. Toward 2071–2100, the signal strengthens substantially — particularly under RCP8.5 — with high values emerging in Southern Bulgaria, the Rhodope region and along the Black Sea coast.

FIGURE 02Spatial distribution of changes in the PI Index

Difference relative to 1981–2010 · ALADIN-Climate/CNRM · RCP4.5 and RCP8.5

CHART PLACEHOLDER

Replace this placeholder with Figure 2 from the report.

09 / MODEL SIGNAL MEETS OBSERVED REALITY

The strongest modelled signals overlap with places where damaging floods have already occurred.

Southern Bulgaria, the Rhodope region, Eastern Bulgaria and the Black Sea coast contain some of the strongest projected PI Index increases. These areas overlap with locations of observed disasters including Asparuhovo, Karlovo, Tsarevo and Elenite.

OVERLAPModelled intensity signal + observed flood disasters

This does not mean climate alone determines each event. It shows that the spatial climate signal and observed vulnerability are converging in several high-risk regions.

10 / THE BIGGER PICTURE

Flood resilience requires spatial diagnosis, critical-point identification and risk management.

Flood risk in Bulgaria is the result of interaction between the climate signal, geographic structure and anthropogenic transformation. As flash-flood risk grows in small and rapidly responding catchments, adaptation must focus on how and where the system can fail — not only on how much rain is expected.

01Spatial diagnosis

Identify the catchments and settlements where climatic and geographic sensitivity overlap.

02Critical points

Map bottlenecks, vulnerable infrastructure and locations where system failure can amplify runoff impacts.

03Risk management

Combine monitoring, planning and adaptation around fast-changing flood conditions.
en_USEnglish
Scroll to Top