
For decades, Bulgaria’s grid followed the rhythm of its consumers: demand rose in the morning, eased overnight, and hydro helped the system follow these changes around a largely steady nuclear and thermal backbone. Now a second rhythm is shaping the grid – the rise and fall of the sun. Solar generation has grown from a relatively small contributor into a force large enough to reshape the daily balance between supply and demand. In 2026, Bulgaria had 7,159 MW of installed solar capacity, around 30% of its total generating capacity (1,055 MW more than just a year earlier, or a 17% increase in a single year).
But this clean energy revolution comes with a profound, systemic challenge: net load variability. “Net load” – the total electricity demand minus the contribution of variable renewable energy sources (VRES) like wind and solar – has become a daily rollercoaster.
Looking at a full year of hourly data reveals how far this shift has already gone – and how differently it is playing out across Bulgaria, Greece and Romania.
Bulgaria’s Daily Rhythm (and How Its Neighbours Compare)
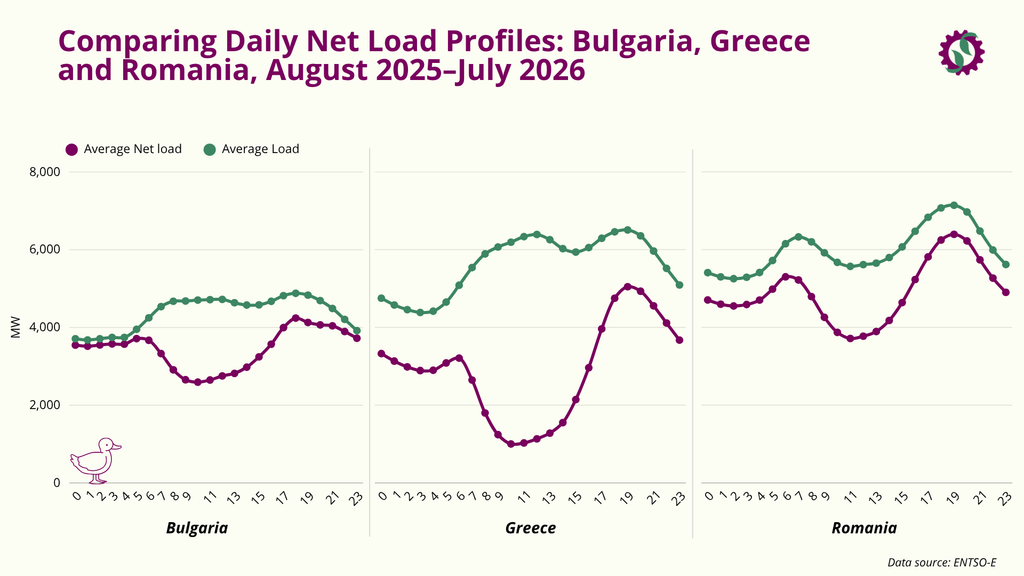
To see the effect of Bulgaria’s solar expansion, it is enough to look at how net load changes over the course of a day. Averaged across the year, the pattern takes on the characteristic shape known as the “duck curve”.
In Bulgaria, net load reaches a morning peak of around 3,700 MW between 05:00 and 07:00. As solar generation increases, it falls by 43%, reaching its lowest point of around 2,600 MW between 10:00 and 12:00. It then rises again as solar production declines, reaching more than 4,000 MW between 18:00 and 20:00 – an increase of around 64% from the midday minimum.
Across the year, average net load was 3,447 MW, while variable renewables covered 22% of total electricity demand. But how does this “duck” compare to Bulgaria’s neighbours?
Greece: A Deeper Duck
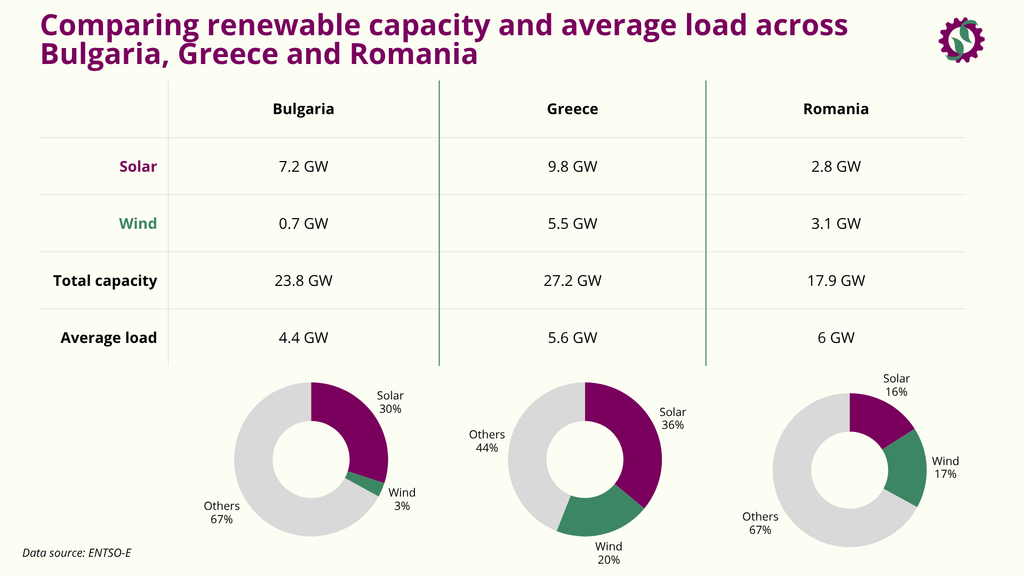
Greece has taken the same solar-driven transition further, while also developing a much larger wind fleet. It has around 9,800 MW of installed solar capacity, representing 36% of total generating capacity, and 5,460 MW of wind, another 20%. Together, these technologies account for more than half of the country’s installed capacity.
The effect is visible in the daily net-load profile. Greece’s midday decline is considerably sharper than Bulgaria’s: net load falls from 3,209 MW at 06:00–07:00 to just 1,001 MW at 10:00–11:00, a reduction of around 69%. The evening reversal is even more pronounced. From the midday minimum, net load rises to 5,045 MW between 19:00 and 20:00 – more than five times the midday value, or an increase of approximately 404%.
This is not simply a consequence of having more solar. Greece also has substantially more wind capacity than Bulgaria, and that difference becomes visible when total load is compared with net load: the two curves remain separated even outside the strongest solar hours, reflecting the continuing contribution of wind generation.
Romania: A More Balanced Curve
Romania presents a different configuration. Its renewable capacity is more evenly split between solar and wind: around 2,788 MW of solar, or 16% of total installed capacity, and 3,068 MW of wind, or 17%. Unlike Bulgaria, where recent renewable growth has been strongly solar-led, Romania has developed the two technologies at a more similar scale.
Its daily net-load curve is consequently less pronounced. Net load falls by around 30%, from 5,300 MW between 06:00 and 07:00 to 3,715 MW between 11:00 and 12:00, before rising by around 72% to 6,393 MW between 19:00 and 20:00.
There is another important difference. Romania’s underlying electricity demand tends to decline somewhat during the day, so its load curve more closely follows the net-load curve. In Bulgaria and Greece, demand is relatively stable or rises towards the evening while solar generation is declining, making the divergence between total load and net load more pronounced.
Taken together, the three countries illustrate that there is no single “renewable curve”. The shape of net load depends not only on how much solar and wind capacity is installed, but also on the balance between the two technologies and on when electricity is consumed.
Figure 1: Daily Load and Net Load Profiles in Bulgaria, Greece and Romania, August 2025–July 2026
Bulgaria’s Seasonal Extremes: From Winter Peaks to Negative Net Load
The daily duck curve becomes more pronounced when viewed across the seasons. Winter concentrates electricity demand in the hours when solar generation is weakest; summer does almost the opposite.
Winter is Bulgaria’s most electricity-intensive season, with an average load of 5,559 MW. Electricity demand for heating is an important part of this picture: the 2021 census found that almost half of occupied dwellings used electricity as their main heating source1. Bulgaria’s Social Climate Plan also points to substantial electrification of heating and cooling, with estimated levels of around 70% in urban areas and 50% in rural areas2. At the same time, winter provides less solar generation. VRES covered an average of only 11% of demand, leaving an average net load of 4,931 MW.
The two January extremes illustrate the effect particularly well. On 21 January, between 11:00 and 12:00, Bulgaria recorded its highest total load of the year, at 7,791 MW. VRES supplied 902.8 MW, or 12% of demand, leaving a net load of 6,888 MW. The net load was already falling slightly at that moment, with a −52 MW ramp, as renewable generation increased relative to demand. The following evening provides the other side of the picture. On 20 January, between 20:00 and 21:00, net load reached its annual maximum of 7,001 MW. Total demand was 7,155 MW, while VRES supplied only 154 MW, or 2%.
The summer pattern is almost the reverse. Average load falls to 3,707 MW, while the average VRES share rises to 33%, bringing average net load down to 2,413 MW. A historic milestone was made on 6 May, between 13:00 and 14:00, when net load fell below zero, reaching −121 MW. Solar generation was 3,570 MW and wind added another 19 MW. Together, VRES generation was equivalent to 104% of instantaneous domestic demand, meaning that variable renewables alone produced more electricity than the country was consuming in that hour, creating a surplus that had to be balanced elsewhere in the interconnected system or through other flexibility mechanisms. The May event was not unique. Net load was negative for five more hours in June, all around midday. There were also 72 hours when VRES covered between 90% and 100% of hourly demand, all during daylight hours.
Solar Dependency and the Role of Wind
The other side of Bulgaria’s solar-heavy system appears after sunset. During 2,114 hours of the year analysed, VRES covered 5% or less of electricity demand. The predominant part of these hours occurred in the evening, underscoring Bulgaria’s high solar dependency and very low levels of wind generation.
This is where comparison with Greece is highly instructive. When Greece’s total load is plotted against its net load, the two curves remain visibly separated even outside the strongest solar hours, reflecting the contribution of wind generation for smoothing out solar volatility. Romania has a similarly balanced renewable mix, with 3,068 MW of wind capacity, or 17% of total installed capacity, alongside 2,788 MW of solar.
Bulgaria’s configuration is different: wind accounts for only 3% of installed capacity, while solar represents around 30%. The result is a much stronger dependence of the hourly renewable contribution on daylight conditions. Once solar generation falls to zero, the remaining net load has to be balanced by the rest of the electricity system – through conventional generation, hydro, imports, storage or other flexibility resources.
Figure 2: Solar and wind capacity in relation to electricity demand in Bulgaria, Greece and Romania, 2026
Bulgaria’s Solar Horizon
The country’s solar expansion is already running ahead of the trajectory set out in its national planning documents. The updated NECP envisaged 5.14 GW of PV capacity in 2027 and 5.5 GW in 2030. Yet the latest ESO transmission plan explicitly notes that photovoltaic capacity has already exceeded the levels projected in the NECP. The pipeline points to continued growth. ESO’s 2026–2035 plan identifies 7.45 GW of additional PV projects based on investment intentions and preliminary or final connection agreements, including 2.66 GW in 2026 and another 2.33 GW in 20273.
For a country whose average load is around 4 GW, that is a substantial shift in the relationship between generation capacity and domestic demand. As solar capacity grows, hours with very high renewable output are likely to become more frequent and potentially more pronounced, as already happened in May and June this year, increasing the amount of electricity that needs to be absorbed, shifted, exported or curtailed.
At the same time, the evening problem does not disappear. Solar generation falls rapidly after sunset, while electricity demand remains high. The same system that can have more renewable generation than domestic demand at midday can therefore face a net load of several thousand megawatts only hours later.
This is where flexibility becomes as important as generation capacity. Storage can move some of the midday surplus into the evening. Flexible consumption can shift demand towards hours of high solar production. Interconnections can increase the ability to trade electricity across borders, while a stronger wind contribution could extend renewable generation beyond daylight hours.
The scale and combination of these solutions will determine whether additional solar capacity primarily translates into more useful renewable electricity – or into increasing volumes of electricity that cannot be consumed when it is produced.
The response is beginning to take shape on the other side of the equation. The same ESO plan identifies 7.61 GW of new electricity-storage projects, with an estimated total storage capacity of around 25 GWh, over 2026–2035. It also envisages a larger role for wind: its 2030 scenario includes around 2 GW of onshore wind and another 500 MW of offshore wind. However, the projects currently identified in the connection pipeline amount to only 747 MW of new wind capacity over the entire 2026–2035 period4.
Bulgaria’s next challenge is therefore not simply to build more solar. It is to build a system that can make use of it. The data from the past year show why: at one end, VRES already exceeded domestic demand; at the other, it sometimes supplied almost none of it. The solar horizon will make the distance between these two moments even more important to manage.